 Data Dashboard Style Guide
Typography
The dashboard will use Poppins — the same typeface the Snake River Headwaters Watershed Group uses on its website, so the dashboard and the site will have one continuous feel.
Type Size
StepSizeWeightSampleUsed for
micro.62rem · 9.3px 600Snake Riverbadges and HIGH/LOW tags
always uppercase · 1px trackingtiny.7rem · 10.5px 500Snake Riversmall labels and timestamps
uppercase as field label (NOW, DATA TYPE) · mixed case as contentcaption.78rem · 11.7px 500Snake Riverchart captions and navigation labels
small.85rem · 12.75px 600Snake Riversection titles and buttons
body-s.9rem · 13.5px 400Snake Riverdetail-panel text and messages
body1rem · 15px 400Snake Riverregular text and subtitles
lead1.1rem · 16.5px 700Snake Riverhighlighted readings
title1.4rem · 21px 600Snake Riversummary numbers and panel titles
heading1.75rem · 26.25px 600Snake Riverstation names
display2.2rem · 33px 700Snake Riverthe big condition verdict
Type Color
Primary Text
Secondary Text: supporting detail and explanations
Faint Text: timestamps, footnotes, and hints
Primary Text
Secondary Text: supporting detail and explanations
Faint Text: timestamps, footnotes, and hints
All text will fit into one of three categories: Primary, Secondary, or Faint. Text should be classified based on importance, and this will naturally be reflected in a high contrast tn lower contrast theme, that immediately draws viewers to the important text first, and then reveals further details upon closer inspection. This already matches the theme of the dashboard, but will consolidate many colors and variations into three simple bins.
Interface colors
#231F51
Header / nav navyheaders, bottom nav
#65C197
Active greenactive / selected
#e8e8e8
Data-type bar48px, tablet+desktop
#ffffff
Surface whitepopups, cards, pills text plates
#659AD2
Hover accentinteractive hover
Data Read Colors
Every reading on the dashboard will use one consolidated color-ramp: colorblind, and contrast friendly. This color-ramp is applied across all data sources using standard principles of high-low, or ideal to poor conditions based on a fish-based system, to get a visually consistent and quick read on any data source independently or comparatively.
True
#750012#A23400#B55F00#C88800#0E768C#024D71#002144
Color blind preview
Protanopia
Deuteranopia
Tritanopia
Color-Ramp Mapped to Current Data Types
Water temperature
Dangerous Exposure
73+ °F
Mortality Risk
70–73 °F
Stressful
68–70 °F
Semi-stressful
66–68 °F
Sub-optimal
62–66 °F
Optimal Habitat
50–62 °F
Cold
<50 °F
Dissolved oxygen
Lethal
<3 mg/L
Stressful
3–5 mg/L
Sub-optimal
5–7 mg/L
Optimal
>7 mg/L
pH
Too Alkaline
>9.5
Slightly Alkaline
9.0–9.5
Healthy
7.0–9.0
Slightly Acidic
6.0–7.0
Too Acidic
<6.0
Discharge
Well Below Normal
<P10
Below Normal
P10–P25
Normal
P25–P75
Above Normal
P75–P90
Well Above Normal
>P90
Turbidity
Very Turbid
50+ FNU
Turbid
25–50 FNU
Slightly Turbid
5–25 FNU
Clear
<5 FNU
Lake elevation
Very Low Pool
<P10
Low Pool
P10–P25
Typical
P25–P75
High Pool
P75–P90
Near Full
>P90
Color-Ramp Alternate Symbol Tier
For map symbology, the same colors are brightened slightly so the dots stand out against the terrain, and every dot gets a thin white ring. Stations that aren’t reporting show as a neutral grey.
#9a0018
#d64500
#e37700
#C88800
#129cb9
#036695
#002c5a
#6b6b6b no data
Data Variable Colors
#332288
Discharge
#41A393
Water temp
#AA4499
pH
#CC6677
Dissolved oxygen
#882255
Turbidity
#117733
Lake elevation
Color blind preview
True
#332288#41A393#AA4499#CC6677#882255#117733
Protanopia
Deuteranopia
Tritanopia
Every data type gets an assigned color, used on its icon and to underline whichever data tab is active in the map or list view. These colors should be used on icons and as a highlight to show which data types are "active", but should never be used for text.
Custom Basemap
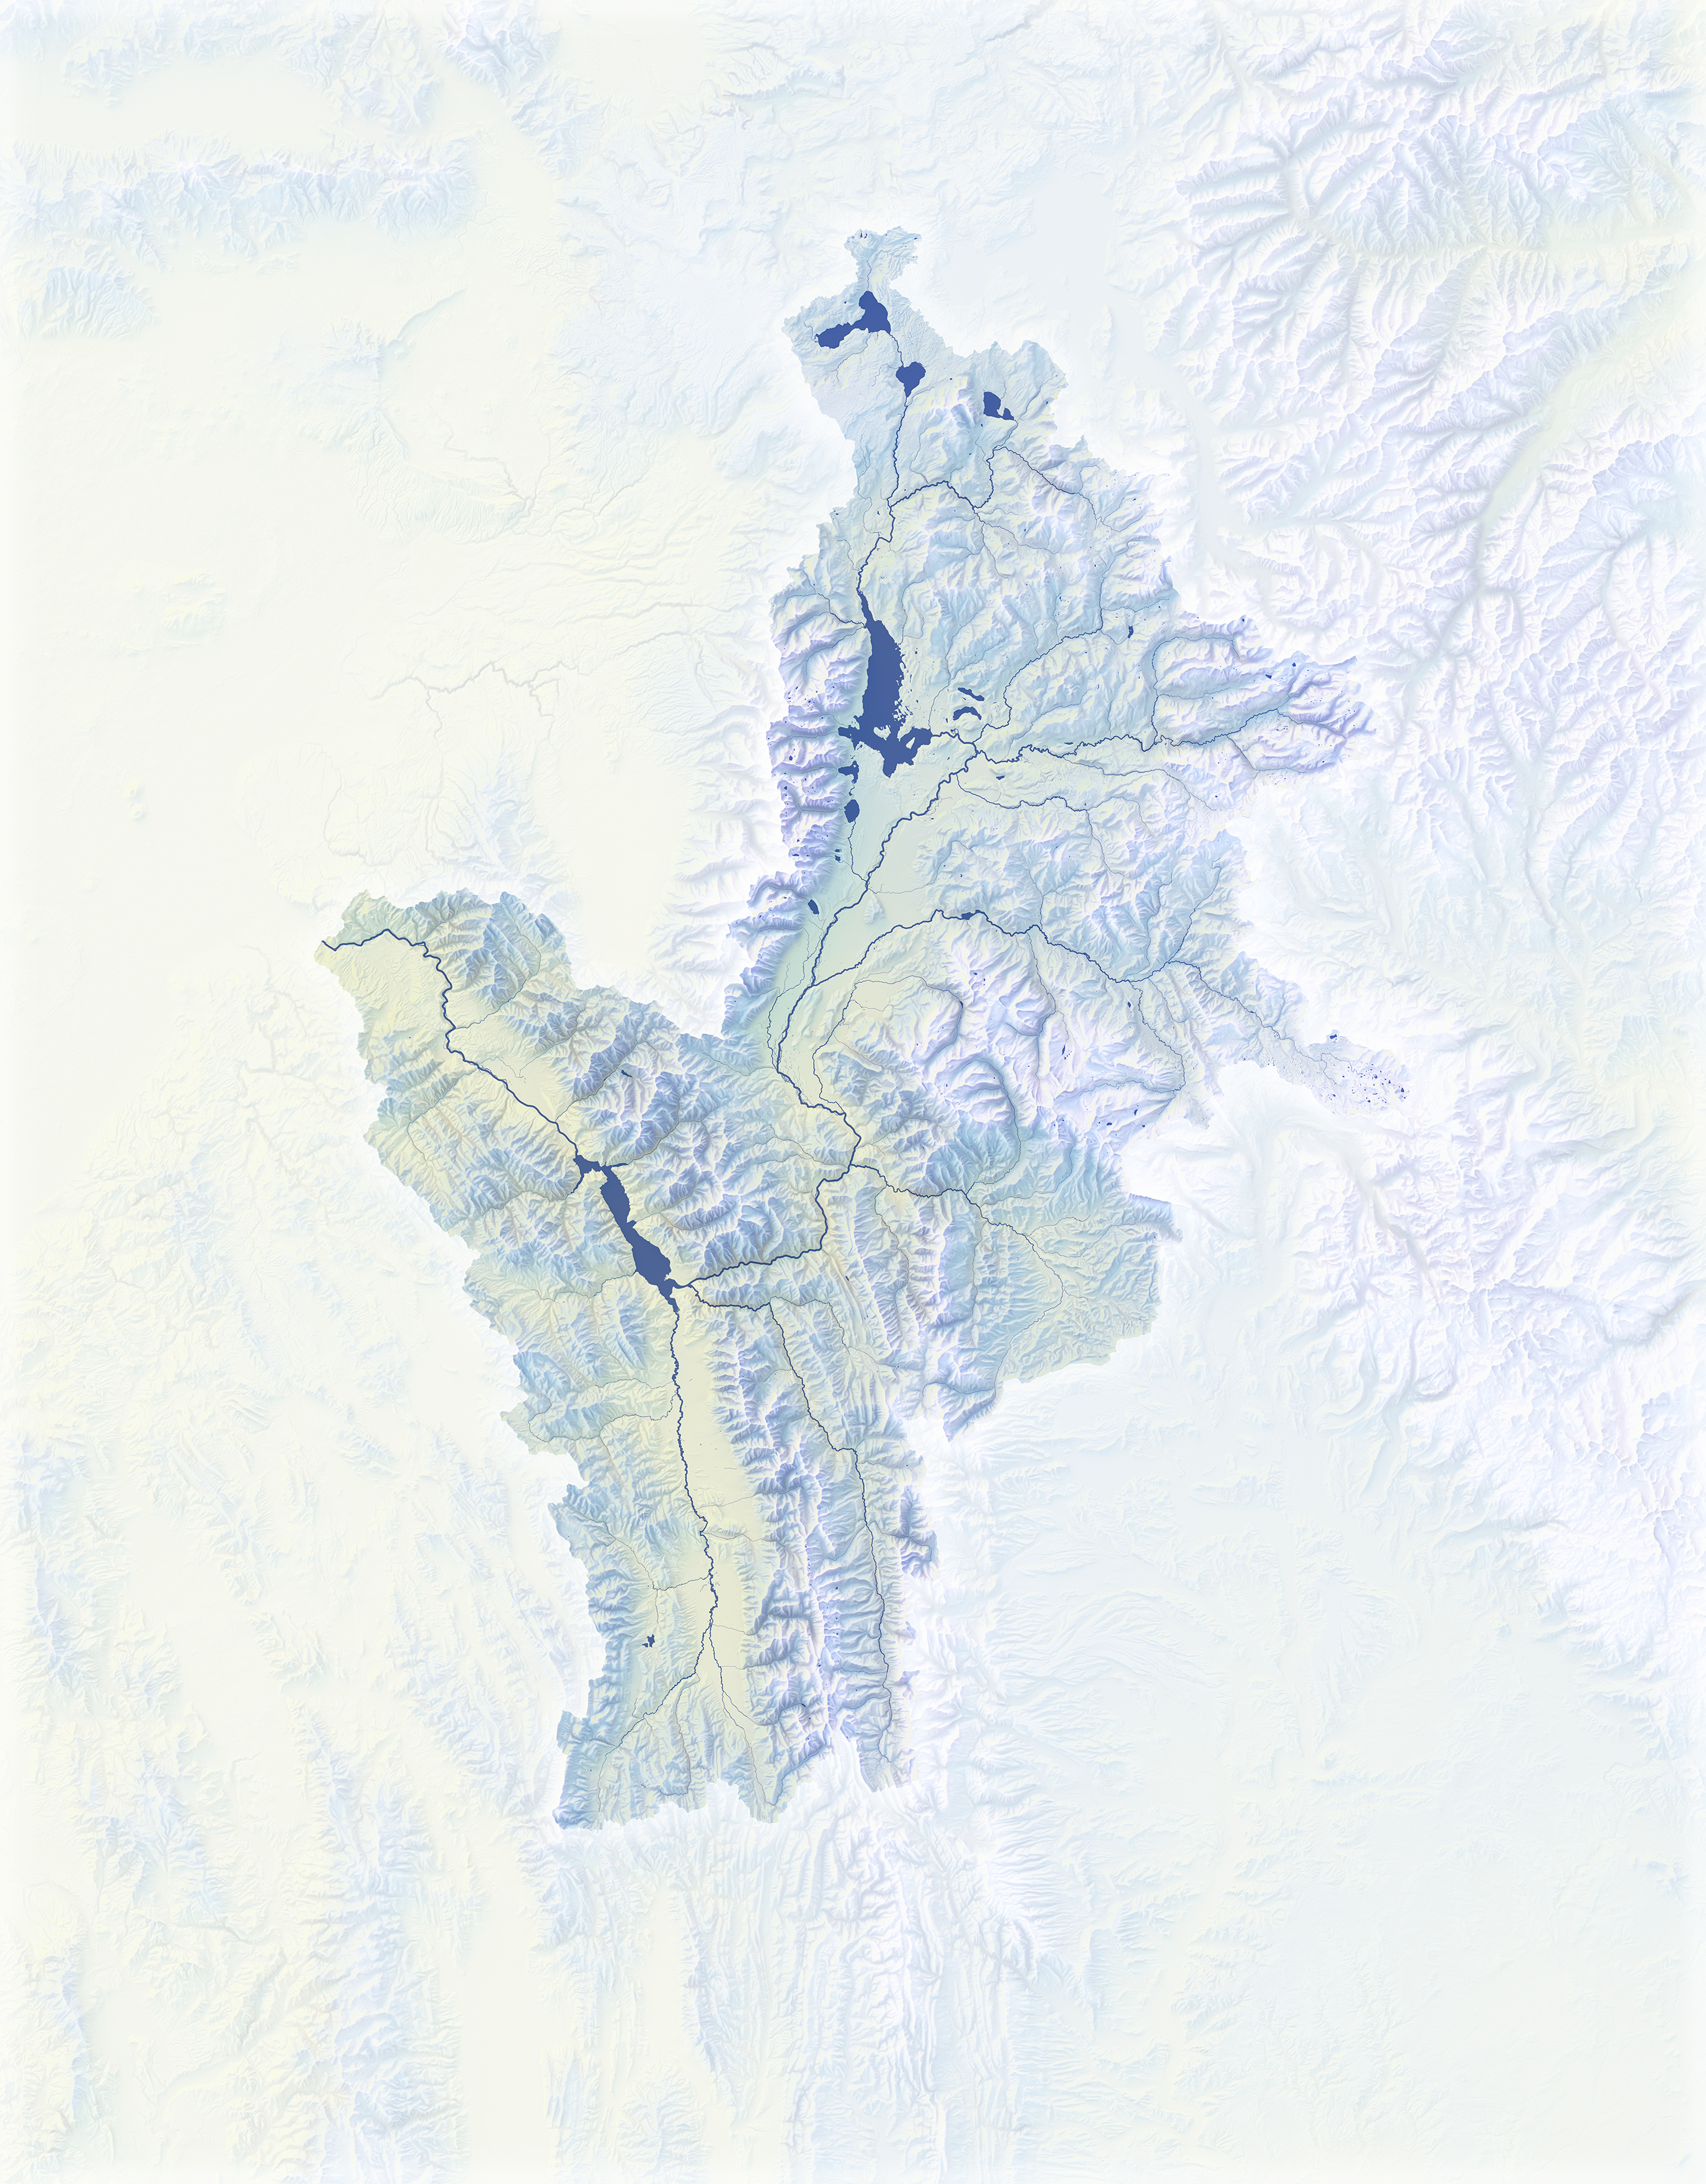
This shows a draft of what the basemap will look like when live. The map will highlight the hydrologic network of the Snake River Headwaters, with varying line widths for each reach based on gage-adjusted annual flow estimates provided by NHDPlus. The basemap will also give context to watershed topography and boundaries, and create a clearer understanding of the watershed for viewers at a glance, while allowing live site data to be the most prominent thing on the page. The basemap could optionally show the road network, town names, and public land boundaries, or eventually incorporate recreation sites.